Lean principles helped us design a budget process that serves our customers better, includes some vivid performance graphs, and facilitates frequent updates for continued fine-tuning. We scrapped the annual process focused on big spreadsheets, in favor of summarized ratios and relative performance that we can update quarterly. We’ve dubbed it our “lean budget”.

Lean Performance Feedback – intuitive view of the profitability universe
Budgeting seems to be universally acknowledged as a necessary evil; never quite living up to its text-book potential, but apparently indispensable “somewhere” in the organization. By taking a fresh look at various budget preconceptions through a “lean” perspective, we believe the budget process can be simplified, and the resultant performance measurements can be made much more relevant, and actionable.
The first two lean principles led us to redefine our primary customer, and highlighted that several of our process steps added no real value (or were actually a distraction). Lean principle three led us to drop the forecasted volume element of our process and align our budget and performance tracking on relative ratios normalized to the same unit basis.
By dropping the forecasted volume components we remove one of the biggest components of error. We also insulate our lean budget process from many organizational biases and political influences.
When forecasting the outcomes of risky projects, executives all too easily fall victim to what psychologists call the planning fallacy. In its grip, managers make decisions based on delusional optimism rather than on a rational weighting of gains, losses, and probabilities. They overestimate benefits and underestimate costs. They spin scenarios of success while overlooking the potential for mistakes and miscalculations.
Once we get everyone thinking in terms of a volume-normalized ratio, it’s a lot easier to compare departments on an equal footing. We can quickly sort the ten biggest variance departments and focus the management team.

Departments sorted for 10 most “influential” negative variances
The department manager now has a quick view, month-to-month, each normalized on a volume basis. Assuming we employ some rigor in standardizing departmental statistics, we can also compare across multiples sites and compare to peer departments.
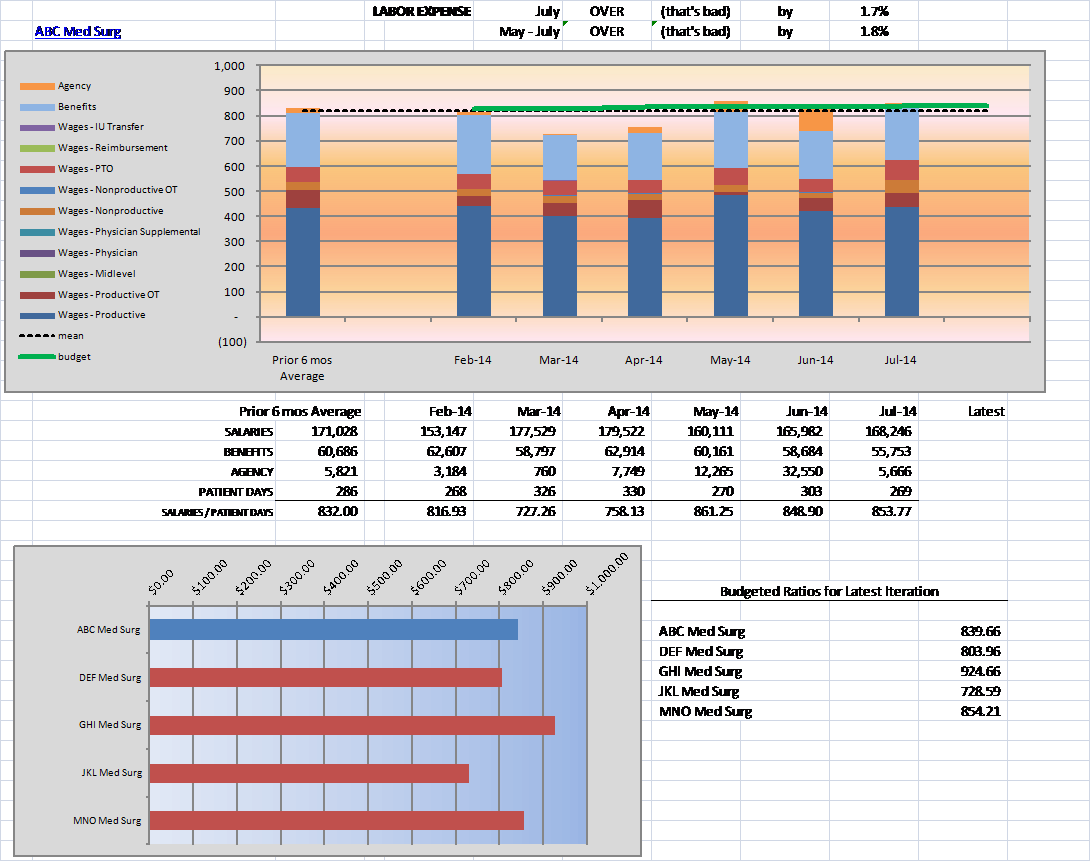
Departments can compare their internal ratio trend, and compare to their peers